
Government & Regulatory | Top Story
EIA’s “Glut” Calls: The 2025 Surplus Claim — and How 2021–2024 Forecasts Actually Held Up

The “~2.2 MMb/d glut in 2025” framing traces to the EIA’s Short-Term Energy Outlook (STEO), December 2025. EIA doesn’t usually write “glut” in the tables—what they publish is the implied balance via inventories: “world total crude oil and other liquids inventory net withdrawals.” A negative number means inventory builds (supply > demand). In the December 2025 STEO, the 2025 world total is –2.24 MMb/d, which is where the “~2.2” number comes from.
But the better question is the one you’re asking: do these big balance calls hold up when you look back? So below is a clean “forecast vs. reality” check for 2021–2024.
How the back-test works
-
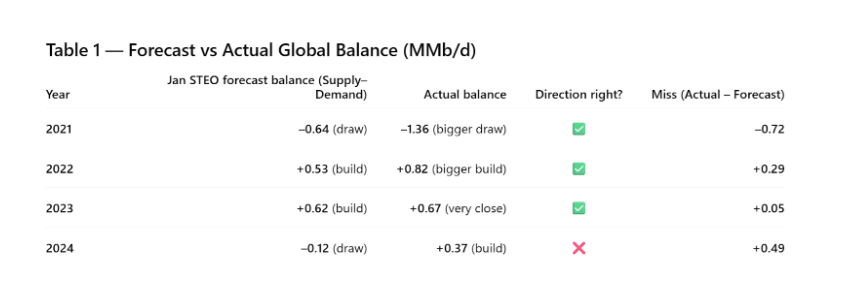
Forecast = what EIA said in the January STEO for that year (their “start-of-year” view)
-
Actual = what EIA later carried as history in the December 2025 STEO dataset
Metric = World petroleum and other liquids supply and consumption, in MMb/d
What this says in plain English:
-
EIA was directionally correct in 2021–2023 (draw, then builds).
-
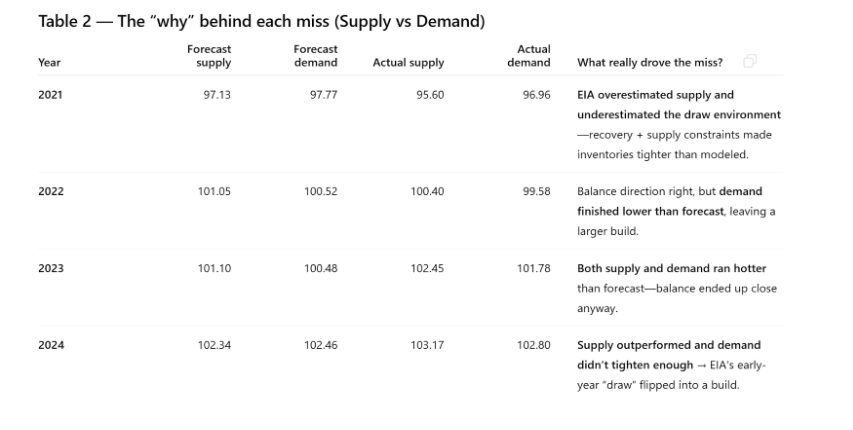
2024 is the key exception: EIA started the year calling for a slight draw, but the year finished as a noticeable build.
The conclusions you can actually use
1) “Big surplus” headlines are not the main problem — direction flips are
The main credibility hit isn’t a 0.2–0.3 MMb/d magnitude miss. It’s when the call changes sign.
That’s exactly what happened in 2024: EIA began the year calling a slightly tighter market, but it ended as a looser market. That’s the kind of miss that can mislead decision-makers (hedging, capital pacing, inventory strategy).
2) EIA’s forecasts tend to be “smooth” — reality is lumpy
2021 shows the classic pattern: EIA called a draw, but underestimated how tight it would be. When markets are moving through regime shifts (post-COVID recovery, sanctions, OPEC+ discipline), EIA often understates volatility.
3) 2023 is the “best case” example of EIA usefulness
In 2023, EIA’s balance was nearly spot-on even though supply and demand both surprised higher. That’s a reminder: EIA can be very useful when the system is stable and the misses cancel.
4) What this implies for the “2.2 MMb/d glut” in 2025
A projected –2.24 MMb/d build rate is huge—but your back-test shows the right mental model:
-
Treat it as a risk flag (market could be looser), not a certainty.
-
The error bands are large enough that if supply under-delivers or demand over-delivers by ~1 MMb/d, the “glut” narrative can shrink fast.
Related Categories :
Government & Regulatory
More Government & Regulatory News
-
Dallas Fed Energy Survey: What Oil and Gas Executives Are Really Saying
-
MEG Energy Rejects Strathcona Resources' $6 Billion Takeover Offer
-
PDC Energy Second Quarter 2022 Results
-
PDC Energy's 69-Well Kenosha Project Approved by COGCC
-
Biden to Release One Million BPD from Reserves for Six Months; Push for Federal Leasehold Production
Canada News >>>
-
Western Canada Upstream M&A: Q1 2026 Transaction Report

-
A Quiet Capital Pattern Is Forming in North American Upstream — and Almost No One Is Talking About It -


-
Canadan E&P 2026 Program Calls for 448 Net Wells, Up 24% vs. 2025 Plan -

-
Whitecap Details 2026 Duvernay & Montney Program

-
ARC Resources: Lower 2026 Capex, Higher Volumes


